약 1년 정도 EKS fargate + grafana 로 모니터링과 알람을 사용했다. 이왕 설치했으니까, 나름 피곤한 세팅 해가면서, 이쁘게 커스텀 잘 해왔는데, 보안 점검때마다 EKS 와 plugin 을 최신버전으로 올리는 바람에 그 때마다 Node 날아가고 전부 새로 설치+세팅 해야 한다는 점... 한번은 그냥 기분 좋게 했었는데, 두번은 못하겠다. 이게 다 fargate 를 사용해서...? AWS 의 EKS 인 만큼, AWS 안에서 모니터링과 알람을 만드는 것이 옳다고 생각하고 방법을 찾아봤다.
CPU / MEM / Traffic 모니터링은 기본이고, 배포시(혹은 장애시) 슬랙 알림 전송이 목표이며, 유일하게 AWS CloudWatch Container Insights 를 찾았다.
Container Insights 는 ECS/EKS 의 EC2/Fargate 에서 컨테이너 어플리케이션의 지표 및 로그를 수집하고 집계할 수 있다. 일반적으로 워커노드의 kubelet 이 /metrics/cadvisor 엔드포인트에서 CPU, 메모리, 디스크, 네트워크 사용량 등의 리소스 지표를 노출하는데, EKS Fargate 네트워킹 구조상 이 kubelet 에 접근이 안되기 때문에 프록시 역할을 할 ADOT(AWS Distro for OpenTelemetry 수집기를 사용하여, 워커노드의 지표 및 로그(CPU, 메모리, 트래픽) 들을 CloudWatch 로 전달한다. 그럼에도 CloudWatch 의 [향상된 관찰 기능] 은 지원되지 않는다.
ADOT Pod 생성
1. fargate profile 생성
$ kubectl create namespace fargate-container-insights
namespace/fargate-container-insights created
2. 서비스 계정 생성
ADOT 수집기에는 성능 로그 이벤트를 CloudWatch로 보내려면 IAM 권한이 필요하다. AWS 관리형 정책 CloudWatchAgentServerPolicy 와 연결할 역할(EKS-Fargate-ADOT-ServiceAccount-Role)을 만들고, EKS 의 서비스계정(adot-collector) 을 생성하여 연결하는 스크립트이다. YOUR-EKS-CLUSTER-NAME 과 YOUR-EKS-CLUSTER-REGION 을 적절히 수정한다.
$ ##!/bin/bash
CLUSTER_NAME=YOUR-EKS-CLUSTER-NAME
REGION=YOUR-EKS-CLUSTER-REGION
SERVICE_ACCOUNT_NAMESPACE=fargate-container-insights
SERVICE_ACCOUNT_NAME=adot-collector
SERVICE_ACCOUNT_IAM_ROLE=EKS-Fargate-ADOT-ServiceAccount-Role
SERVICE_ACCOUNT_IAM_POLICY=arn:aws:iam::aws:policy/CloudWatchAgentServerPolicy

$ eksctl utils associate-iam-oidc-provider \
--cluster=$CLUSTER_NAME \
--approve

$ eksctl create iamserviceaccount \
--cluster=$CLUSTER_NAME \
--region=$REGION \
--name=$SERVICE_ACCOUNT_NAME \
--namespace=$SERVICE_ACCOUNT_NAMESPACE \
--role-name=$SERVICE_ACCOUNT_IAM_ROLE \
--attach-policy-arn=$SERVICE_ACCOUNT_IAM_POLICY \
--approve

2023-11-27 22:09:08 [ℹ]  eksctl version 0.75.0
2023-11-27 22:09:08 [ℹ]  using region ap-northeast-2
2023-11-27 22:09:09 [ℹ]  1 iamserviceaccount (fargate-container-insights/adot-collector) was included (based on the include/exclude rules)
2023-11-27 22:09:09 [!]  serviceaccounts that exist in Kubernetes will be excluded, use --override-existing-serviceaccounts to override
2023-11-27 22:09:09 [ℹ]  1 task: {
    2 sequential sub-tasks: {
        create IAM role for serviceaccount "fargate-container-insights/adot-collector",
        create serviceaccount "fargate-container-insights/adot-collector",
    } }2023-11-27 22:09:09 [ℹ]  building iamserviceaccount stack "eksctl-test-addon-iamserviceaccount-fargate-container-insights-adot-collector"
2023-11-27 22:09:10 [ℹ]  deploying stack "eksctl-test-addon-iamserviceaccount-fargate-container-insights-adot-collector"
2023-11-27 22:09:10 [ℹ]  waiting for CloudFormation stack "eksctl-test-addon-iamserviceaccount-fargate-container-insights-adot-collector"
2023-11-27 22:09:26 [ℹ]  waiting for CloudFormation stack "eksctl-test-addon-iamserviceaccount-fargate-container-insights-adot-collector"
2023-11-27 22:09:43 [ℹ]  waiting for CloudFormation stack "eksctl-test-addon-iamserviceaccount-fargate-container-insights-adot-collector"
2023-11-27 22:09:43 [ℹ]  created serviceaccount "fargate-container-insights/adot-collector"
파일을 다운받아, YOUR-EKS-CLUSTER-NAME 과 region=us-east-1 을 적절히 수정하여 배포한다.
$ kubectl apply -f eks-fargate-container-insights.yaml
clusterrole.rbac.authorization.k8s.io/adotcol-admin-role created
clusterrolebinding.rbac.authorization.k8s.io/adotcol-admin-role-binding created
configmap/adot-collector-config created
service/adot-collector-service created
statefulset.apps/adot-collector created
4. CloudWatch Log Group 확인
몇 분이 지나면 CloudWatch 로그 그룹에 로그가 쌓이는 것을 확인할 수 있다. /aws/containerinsights/CLUSTER_NAME/performance
5. CloudWatch 대시보드 생성
Metrics > ContainerInsights 지표를 활용하여 CPU, 메모리, 트래픽 정도의 대시보드를 구현할 수 있다. (배포 알림은 ContainerInsights 가 아닌 ALB target-group 의 HealthyHostCount 로 측정하였음. PromQL 가 없으니 잇몸으로...)
초창기에 EKS 를 fargate 로 세팅한 후에 모니터링을 위해 prometheus 까지 만들어 놓으려다가, 실패하고 이제야 설치를 해봤다. 기억으로는 아마도 fargate 때문이었다. 그때까지만 해도 대부분 문서들이 전부 EC2 기반이라 삽질 조금 하다가 깔끔하게 접었었다.
지금은 Fargate / EC2 상관없이 AWS 에서 제공하는 AMP(Amazon Managed Service for Prometheus) 를 이용하면 쉽게 연동이 가능할 것 같은데, 역시나 서울 리전은 아직 해당 서비스를 제공하지 않는다. 그리하여 짬 내서 다시 한번 시도해 보았다.
일단 나는 EC2 를 쓸 생각이 없었는데, Prometheus 는 Fargate 로 설치할 수 없다. Prometheus 의 시계열 데이터베이스가 컨테이너 재시작 중에 손실되지 않도록 영구 볼륨(Persistent Volumes) 을 사용하여 Prometheus 에 지속성을 제공해야 한다. 그러려면 우선 EKS 에서 EC2 노드 그룹 (Node Group) 을 생성해야 한다.
1. Add Node Group
노드 그룹을 생성할 때는, 노드 IAM 역할(role) 을 필요로 한다.
IAM 대시보드에서 아래 두가지 정책을 포함하는 역할(ex. EksEC2nodeGroupRole) 을 만든다. - AmazonEKSWorkerNodePolicy - AmazonEC2ContainerRegistryReadOnly
또한, 쿠버네티스의 서비스계정에서 IAM 역할을 사용할 수 있도록 Amazon VPC CNI plugin 을 구성한다.
# aws-node 서비스계정 생성/업데이트
$ eksctl create iamserviceaccount \
    --name aws-node \
    --namespace kube-system \
    --cluster my-cluster \
    --role-name "AmazonEKSVPCCNIRole" \
    --attach-policy-arn arn:aws:iam::aws:policy/AmazonEKS_CNI_Policy \
    --override-existing-serviceaccounts \
    --approve

2023-01-31 17:42:15 [ℹ]  eksctl version 0.75.0
2023-01-31 17:42:15 [ℹ]  using region ap-northeast-2
2023-01-31 17:42:16 [ℹ]  1 iamserviceaccount (kube-system/aws-node) was included (based on the include/exclude rules)
2023-01-31 17:42:16 [!]  metadata of serviceaccounts that exist in Kubernetes will be updated, as --override-existing-serviceaccounts was set
2023-01-31 17:42:16 [ℹ]  1 task: {
    2 sequential sub-tasks: {
        create IAM role for serviceaccount "kube-system/aws-node",
        create serviceaccount "kube-system/aws-node",
    } }2023-01-31 17:42:16 [ℹ]  building iamserviceaccount stack "eksctl-my-cluster-addon-iamserviceaccount-kube-system-aws-node"
2023-01-31 17:42:16 [ℹ]  deploying stack "eksctl-my-cluster-addon-iamserviceaccount-kube-system-aws-node"
2023-01-31 17:42:16 [ℹ]  waiting for CloudFormation stack "eksctl-my-cluster-addon-iamserviceaccount-kube-system-aws-node"
2023-01-31 17:42:33 [ℹ]  waiting for CloudFormation stack "eksctl-my-cluster-addon-iamserviceaccount-kube-system-aws-node"
2023-01-31 17:42:49 [ℹ]  waiting for CloudFormation stack "eksctl-my-cluster-addon-iamserviceaccount-kube-system-aws-node"
2023-01-31 17:43:09 [ℹ]  waiting for CloudFormation stack "eksctl-my-cluster-addon-iamserviceaccount-kube-system-aws-node"
2023-01-31 17:43:26 [ℹ]  waiting for CloudFormation stack "eksctl-my-cluster-addon-iamserviceaccount-kube-system-aws-node"
2023-01-31 17:43:26 [ℹ]  serviceaccount "kube-system/aws-node" already exists
2023-01-31 17:43:26 [ℹ]  updated serviceaccount "kube-system/aws-node"
role 과 serviceAccounts 설정을 마쳤으면 eks 대시보드에서 노드 그룹을 추가/확인 한다. (node 수는 1개만 설정했다. 100G)
$ kubectl get pods -w -n kube-system
NAME                                            READY   STATUS    RESTARTS   AGE
aws-node-q123f                                  1/1     Running   0          4h5m
kube-proxy-abcmh                                1/1     Running   0          4h5m
...
EKS 콘솔의 추가기능에서 Amazon EBS CSI 드라이버(v1.23 버전부터 EC2 노드그룹 사용시 필요) 를 설치해야 하는데 IAM 역할을 미리 생성 해준다. (해당 권한이 올바로 설치되지 않으면 아래 storage 가 생성되지 못한다.)
# prometheus install
$ helm repo add prometheus-community https://prometheus-community.github.io/helm-charts

$ helm install prometheus prometheus-community/prometheus \
     --namespace prometheus \
     --set alertmanager.persistentVolume.storageClass="gp2" \
     --set server.persistentVolume.storageClass="gp2"

NAME: prometheus
LAST DEPLOYED: Tue Jan 31 13:04:08 2023
NAMESPACE: prometheus
STATUS: deployed
REVISION: 1
NOTES:
The Prometheus server can be accessed via port 80 on the following DNS name from within your cluster:
prometheus-server.prometheus.svc.cluster.local


Get the Prometheus server URL by running these commands in the same shell:
  export POD_NAME=$(kubectl get pods --namespace prometheus -l "app=prometheus,component=server" -o jsonpath="{.items[0].metadata.name}")
  kubectl --namespace prometheus port-forward $POD_NAME 9090


The Prometheus alertmanager can be accessed via port  on the following DNS name from within your cluster:
prometheus-%!s(<nil>).prometheus.svc.cluster.local


Get the Alertmanager URL by running these commands in the same shell:
  export POD_NAME=$(kubectl get pods --namespace prometheus -l "app=prometheus,component=" -o jsonpath="{.items[0].metadata.name}")
  kubectl --namespace prometheus port-forward $POD_NAME 9093
#################################################################################
######   WARNING: Pod Security Policy has been disabled by default since    #####
######            it deprecated after k8s 1.25+. use                        #####
######            (index .Values "prometheus-node-exporter" "rbac"          #####
###### .          "pspEnabled") with (index .Values                         #####
######            "prometheus-node-exporter" "rbac" "pspAnnotations")       #####
######            in case you still need it.                                #####
#################################################################################


The Prometheus PushGateway can be accessed via port 9091 on the following DNS name from within your cluster:
prometheus-prometheus-pushgateway.prometheus.svc.cluster.local


Get the PushGateway URL by running these commands in the same shell:
  export POD_NAME=$(kubectl get pods --namespace prometheus -l "app=prometheus-pushgateway,component=pushgateway" -o jsonpath="{.items[0].metadata.name}")
  kubectl --namespace prometheus port-forward $POD_NAME 9091

For more information on running Prometheus, visit:
https://prometheus.io/
모니터링은 내부에서만 사용할 예정이라 기본사양인 gp2 EBS 볼륨을 사용했으며, alertmanager 용 2G / server 용 8G 볼륨이 생성된다.
# check prometheus pods
$ kubectl get all -n prometheus
NAME                                                    READY   STATUS    RESTARTS   AGE
pod/prometheus-alertmanager-0                           1/1     Running   0          85s
pod/prometheus-kube-state-metrics-7cdcf7cc98-m7n9q      1/1     Running   0          85s
pod/prometheus-prometheus-node-exporter-552n8           0/1     Pending   0          85s
pod/prometheus-prometheus-node-exporter-5hkjp           0/1     Pending   0          84s
pod/prometheus-prometheus-node-exporter-5k54s           0/1     Pending   0          85s
pod/prometheus-prometheus-node-exporter-77gsb           1/1     Running   0          84s
pod/prometheus-prometheus-node-exporter-9ckh5           1/1     Running   0          85s
pod/prometheus-prometheus-node-exporter-gtvht           0/1     Pending   0          85s
pod/prometheus-prometheus-node-exporter-hxkn6           0/1     Pending   0          84s
pod/prometheus-prometheus-node-exporter-rxl4b           0/1     Pending   0          85s
pod/prometheus-prometheus-node-exporter-xr468           0/1     Pending   0          85s
pod/prometheus-prometheus-node-exporter-zqxrm           0/1     Pending   0          85s
pod/prometheus-prometheus-pushgateway-9d598d466-844ct   1/1     Running   0          85s
pod/prometheus-server-6487b794-qtddq                    2/2     Running   0          85s

NAME                                          TYPE        CLUSTER-IP       EXTERNAL-IP   PORT(S)    AGE
service/prometheus-alertmanager               ClusterIP   172.20.40.182    <none>        9093/TCP   85s
service/prometheus-alertmanager-headless      ClusterIP   None             <none>        9093/TCP   85s
service/prometheus-kube-state-metrics         ClusterIP   172.20.106.187   <none>        8080/TCP   85s
service/prometheus-prometheus-node-exporter   ClusterIP   172.20.144.95    <none>        9100/TCP   85s
service/prometheus-prometheus-pushgateway     ClusterIP   172.20.17.45     <none>        9091/TCP   85s
service/prometheus-server                     ClusterIP   172.20.39.89     <none>        80/TCP     85s

NAME                                                 DESIRED   CURRENT   READY   UP-TO-DATE   AVAILABLE   NODE SELECTOR   AGE
daemonset.apps/prometheus-prometheus-node-exporter   10        10        2       10           2           <none>          85s

NAME                                                READY   UP-TO-DATE   AVAILABLE   AGE
deployment.apps/prometheus-kube-state-metrics       1/1     1            1           85s
deployment.apps/prometheus-prometheus-pushgateway   1/1     1            1           85s
deployment.apps/prometheus-server                   1/1     1            1           85s

NAME                                                          DESIRED   CURRENT   READY   AGE
replicaset.apps/prometheus-kube-state-metrics-7cdcf7cc98      1         1         1       86s
replicaset.apps/prometheus-prometheus-pushgateway-9d598d466   1         1         1       86s
replicaset.apps/prometheus-server-6487b794                    1         1         1       86s

NAME                                       READY   AGE
statefulset.apps/prometheus-alertmanager   1/1     86s
만약 alertmanager 가 Pending 상태라면 prometheus uninstall 후에, 해당 EBS 볼륨(아마도 2G)도 직접 삭제하고, pvc도 조회하여 삭제한다. (kubectl delete pvc name -n namespace)... prometheus uninstall 때 기존 alertmanager 관련 볼륨정보가 삭제되지 않는듯... 여러번 설치테스트 하다가 이것 때문에 삽질 좀 했다.
0/9 nodes are available: 1 node(s) had volume node affinity conflict, 8 node(s) had taint {eks.amazonaws.com/compute-type: fargate}, that the pod didn't tolerate.
또한 node-exporter 는 ec2 노드에서 작동하는 daemonset 으로 실행되지만 이미 생성된 fargate 노드들이 daemonset 을 지원하지 않기 때문에 fargate 에서 schedule 을 수행할 수 없다. node-exporter 의 역할은 실행중인 node에 배치되어 해당 호스트의 low-level 매트릭(vCPU, Mem, Network, Disk) 수집을 담당하는데, kube-state-metrics 가 이 메트릭을 대신 수집해 주어 node-exporter 없이도 지표 수집이 가능한 것 같아, node-exporter 를 전부 삭제했다.
$ vi grafana.yaml
datasources:
  datasources.yaml:
    apiVersion: 1
    datasources:
    - name: Prometheus
      type: prometheus
      url: http://prometheus-server.prometheus.svc.cluster.local
      access: proxy
      isDefault: true


# grafana install
$ helm repo add grafana https://grafana.github.io/helm-charts
$ helm install grafana grafana/grafana \
    --namespace prometheus \
    --set persistence.storageClassName="gp2" \
    --set persistence.enabled=true \
    --set adminPassword='admin_password' \
    --values ./grafana.yaml \
    --set service.type=LoadBalancer

W0131 18:50:26.890856   44556 warnings.go:70] policy/v1beta1 PodSecurityPolicy is deprecated in v1.21+, unavailable in v1.25+
W0131 18:50:27.492718   44556 warnings.go:70] policy/v1beta1 PodSecurityPolicy is deprecated in v1.21+, unavailable in v1.25+
NAME: grafana
LAST DEPLOYED: Tue Jan 31 18:50:26 2023
NAMESPACE: prometheus
STATUS: deployed
REVISION: 1
NOTES:
1. Get your 'admin' user password by running:

   kubectl get secret --namespace prometheus grafana -o jsonpath="{.data.admin-password}" | base64 --decode ; echo

2. The Grafana server can be accessed via port 80 on the following DNS name from within your cluster:

   grafana.prometheus.svc.cluster.local

   Get the Grafana URL to visit by running these commands in the same shell:
   NOTE: It may take a few minutes for the LoadBalancer IP to be available.
        You can watch the status of by running 'kubectl get svc --namespace prometheus -w grafana'
     export SERVICE_IP=$(kubectl get svc --namespace prometheus grafana -o jsonpath='{.status.loadBalancer.ingress[0].ip}')
     http://$SERVICE_IP:80

3. Login with the password from step 1 and the username: admin
kubernetes 를 사용하면서 불편했던 점 중에 하나는 서비스 로깅이었다. 로컬에서 가장 자주 사용하던 명령어가 바로...
> kubectl logs -n namespace -f <pod-name>
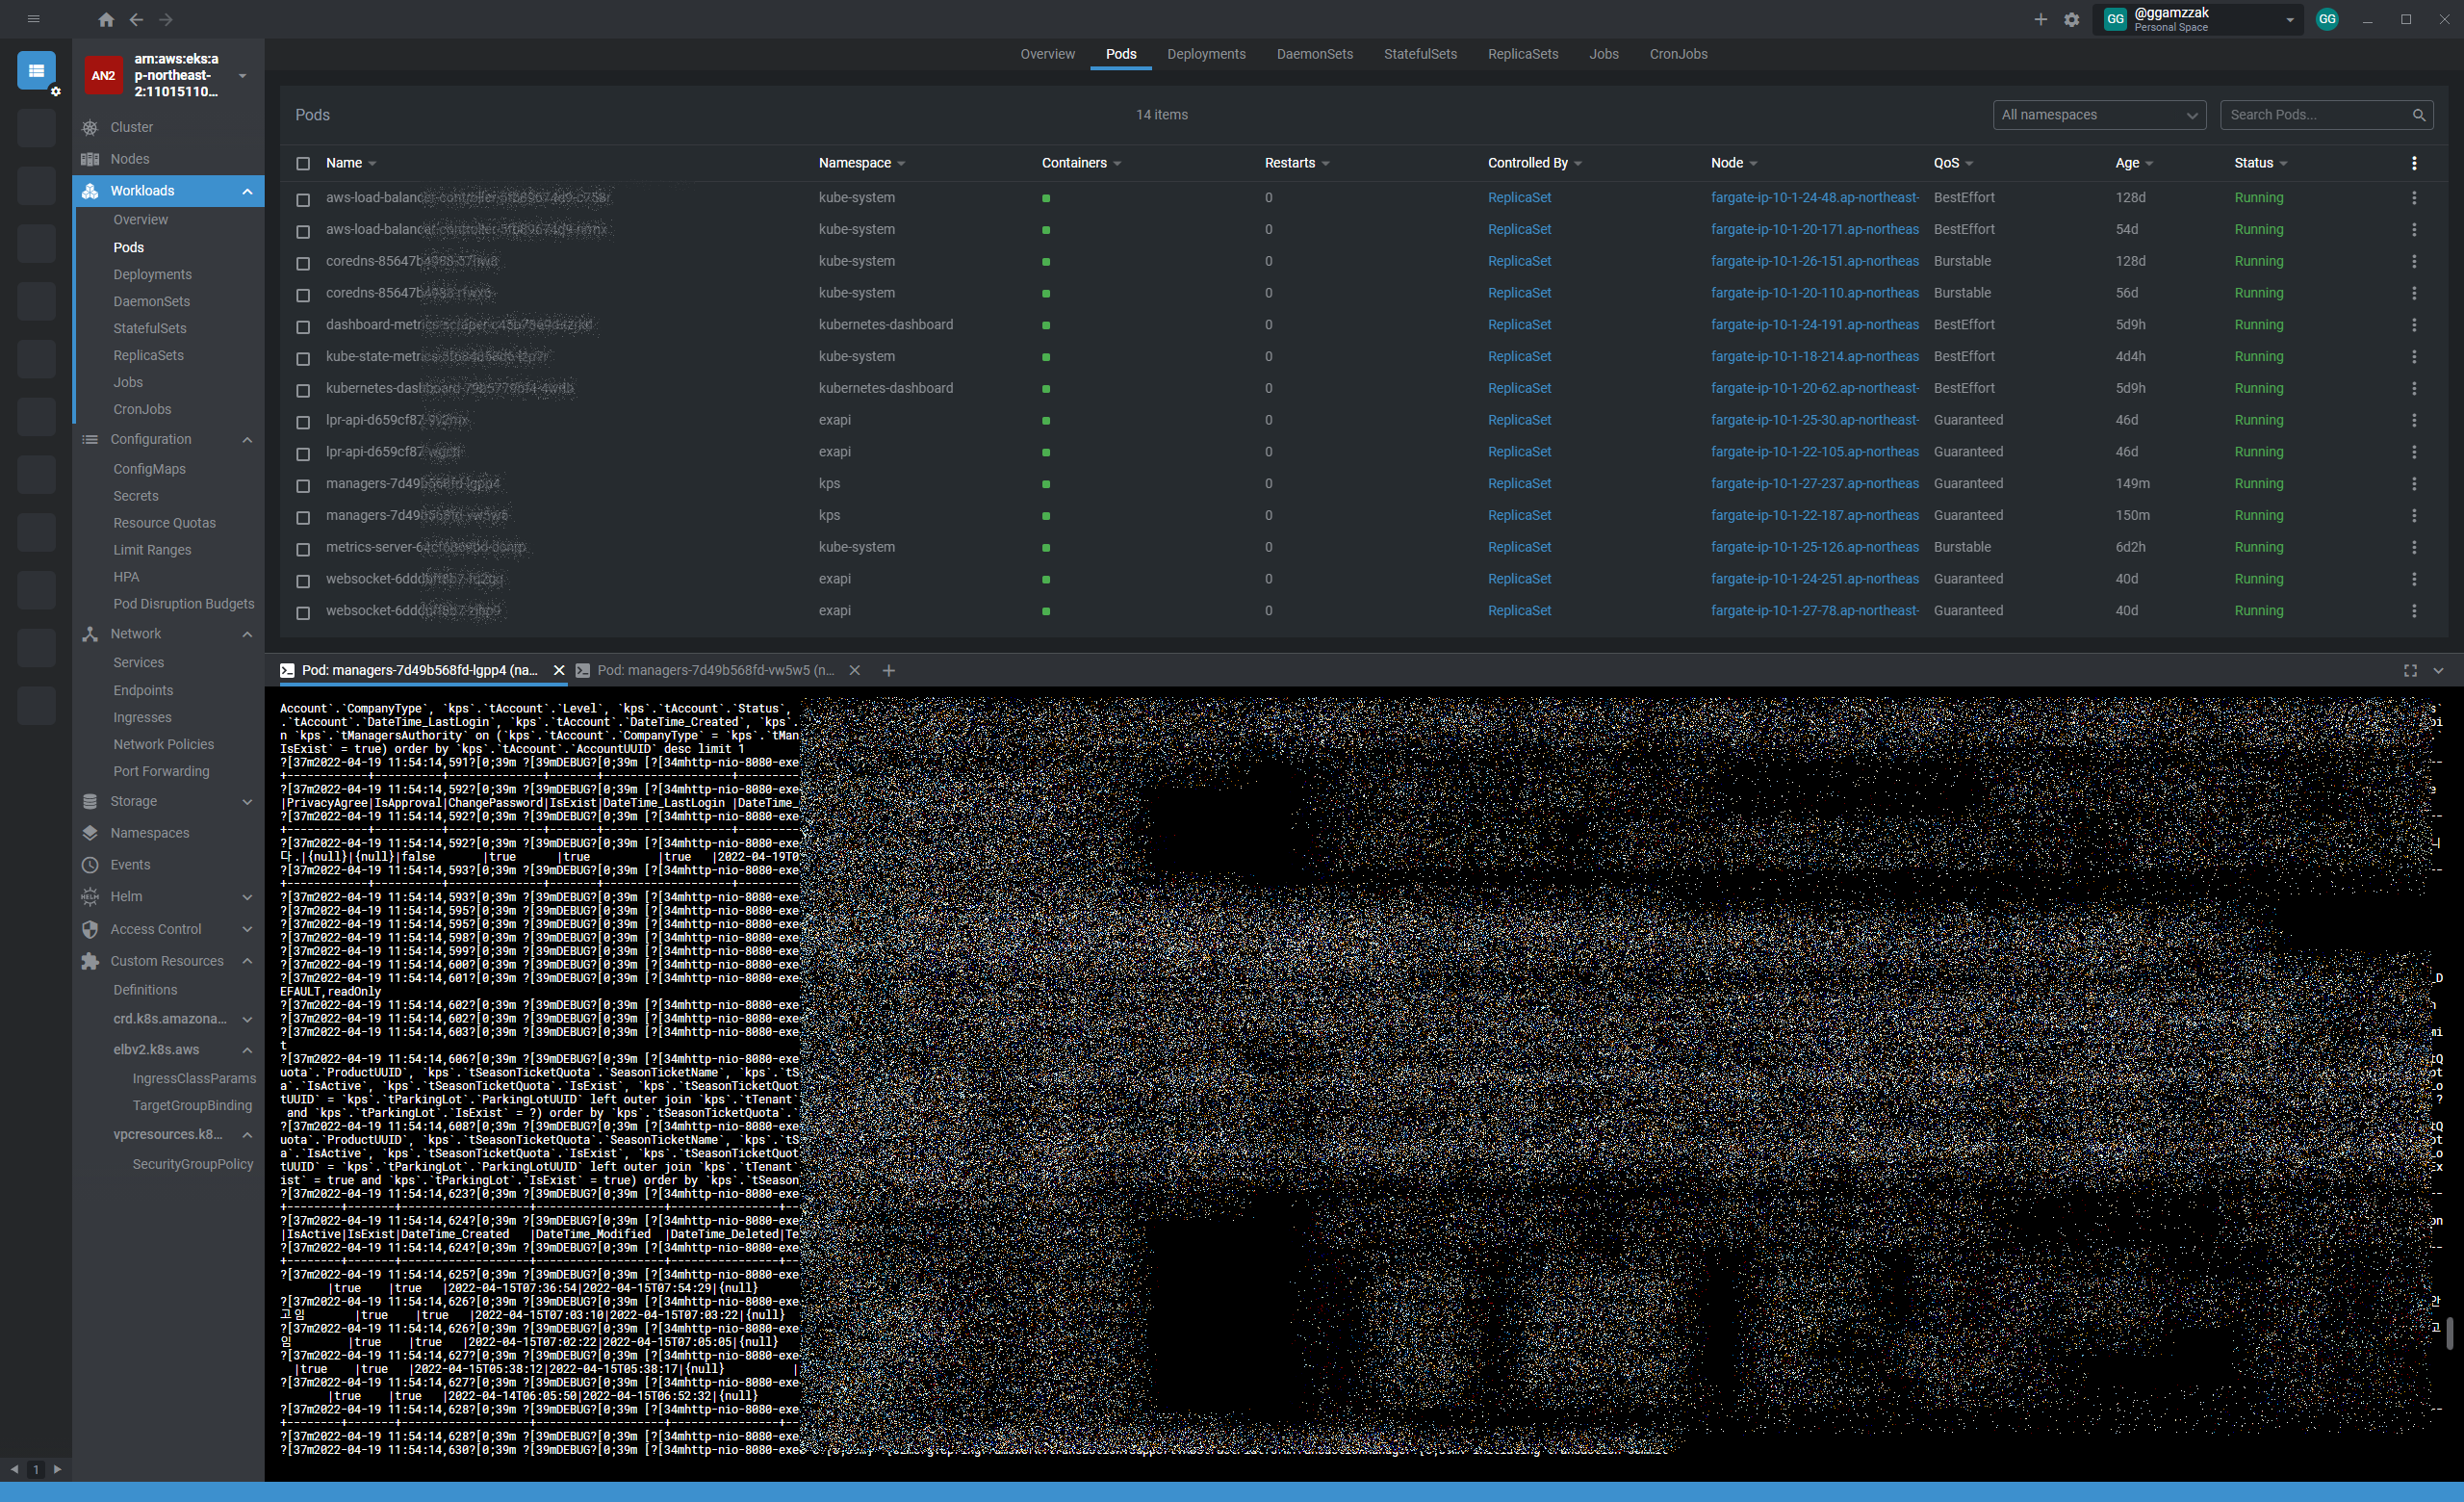
배포(deployment) 하고 나서 로깅/디버깅을 위해 pod 리스트를 나열하고 pod-name 으로 로깅하는 짓이 가장 번거로웠다. 지금은 pod 가 한 10개 정도인데... 창을 10개를 띄워놓을 수도 없고... 그래서 실시간으로 pods 정보를 보여주고, 해당 로그를 스트리밍으로 좀 더 편하게 볼 수 있는 툴을 찾아보기로 했다.
쿠버네티스 모니터링 도구를 찾아보니 꽤나 많이 보이는데 그 중에 몇 가지만 테스트해 보았다.
Kubernetes Dashboard 심플하다. 시스템 모니터는 다른 모든 툴들도 기본적으로 잘 동작한다. CPU / RAM / Workload 등... 하지만 서비스 로깅이 불편하다. 5초 reload 방식... 이것도 대부분의 툴들이 마찬가지.
Prometheus / Grafana 설치 개복잡. Helm 을 사용하면 조금 편함. 잘나가다가 promtail 설정에서 막혔음. Fargate 사용 유저는 엄청난 고뇌가 필요할 듯... 몇가지 대안은 있었지만 로그 하나 보겠다고 굳이 일 벌리고 싶지 않았음. 가장 보편적이기도 하고, Custom / 확장도 좋은 것 같고... 대부분의 회사들이 사용하니 이건 써봐야겠지?
Datadog 시스템 통합으로 사용하고는 있으나... 쿠버네티스에 특화되어 있다기 보다는 로깅 분석에 어울리는... 그렇다고 안되는 건 없는... 그렇다고 굳이 유료 결제할 필요도 없는...?
Lens (Desktop) Kubernetes IDE 답게 쿠버네티스에 특화되어 있음. 얼핏보면 외관은 Prometheus 와 흡사. 클릭 몇번으로 설치 완료. Attach Pod / logs 메뉴로 실시간 로깅은 잘됨. 혼자쓰기 괜츈.